A FRESH TAKE ON MATH
Discover the wonder of mathematics in our everyday world with STEMscopes Math, our all-new approach to math instruction. Built from the ground up by practicing educators using the flexible 5E lesson model, STEMscopes Math provides you with everything you need to create a meaningful learning experience that empowers your students with 21st-century skills to succeed in future STEM careers.
DIGITAL CURRICULUM
STUDENT PRINT
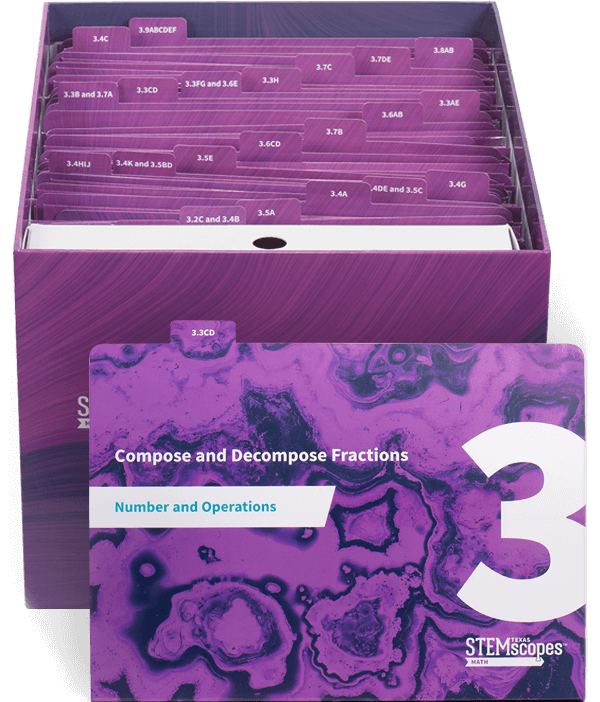
HANDS-ON KITS
OUR CORE VALUES
Constructivist Approach
Using the CRA approach, we provide a powerful, interactive curriculum that encourages your students to rely on critical thinking, compelling reflection, and collaborative exploration within each scope.
Intentional Discourse
Our program promotes collaboration, listening, and expression in a variety of styles through purposeful math discussions that broaden your students’ mindsets and encourage educational growth.
5E + IA in Action
The 5E+IA learning model (Engage, Explore, Explain, Elaborate, Evaluate, Intervention, and Acceleration) is designed to enhance STEM education through math concepts found in our everyday world while being compatible with Math Workshop and Guided Math.
Real-World Exploration
Through open-ended and cross-dimensional tasks, we encourage your students to explore a wide range of mathematical approaches in various contexts.
FEATURES & BENEFITS
- Flexible 5E + Intervention & Acceleration Learning Model
- C-R-A
- Real-world tasks
- Virtual manipulatives
- Interactive games
- Spanish translation
- Assessments for before, during, and after instruction to determine readiness and gauge comprehension
- Background knowledge with concrete representations
- Professional learning embedded within the scopes
- Early intervention to close gaps upon entry to grade level
- Activity to motivate students and prepare them for exploration
- Scaffolded progression of explore activities
- Embedded instructional support within each explore activity
- Specific ELP strategies included with each Explore activity
- Virtual manipulatives (shown in the curriculum and stored in the Teacher Toolbox)

THERE’S MORE TO LOVE
Middle School Math is Here
STEMscopes Math is leveling up with 6th-8th grade and Algebra I curriculum! You’ll recognize some features from our K-5 curriculum, like the 5E + Intervention and Acceleration learning model, but also notice some new goodies, like Data Science activities and improved Daily Numeracy and Fact fluency, Mathematical Modeling Task, Would You Rather, and Choice Board.
Our continued dedication to connecting math to familiar real-world experiences will help you answer that stubborn question every teacher hears: “Why do I need to know this?” Explore a few new features below and then take an in-depth tour of STEMscopes Math for middle school and Algebra I!

EXPLORE OUR VIRTUAL INTERACTIVES
Not every school has access to math manipulatives or enough to support all learners. With virtual manipulatives and PhET Simulations, teacher can enhance equity, empower learning at home, and delight digital natives. From fraction bars to base ten blocks, students can use these digital tools with drag and drop controls to problem solve and continue CRA (concrete-representation-abstract) learning from the comfort of any device.
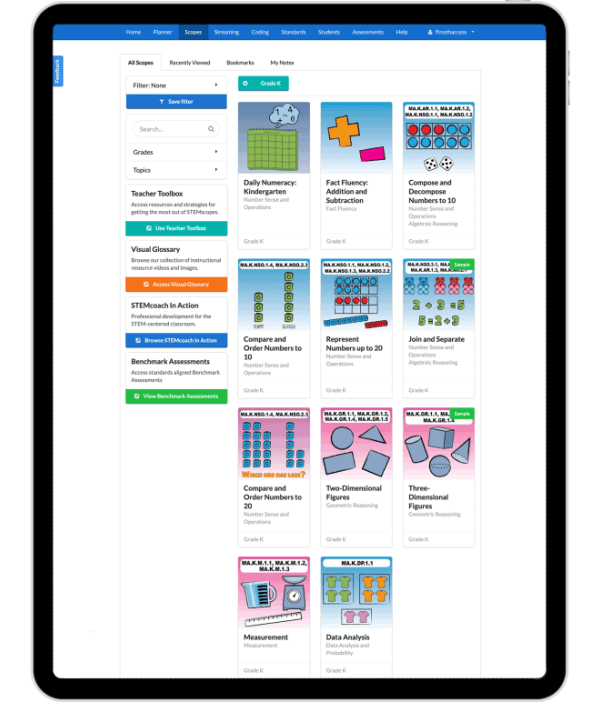
Explore the elements inside a STEMscopes Math lesson:
SCOPE COMPONENTS
Standards
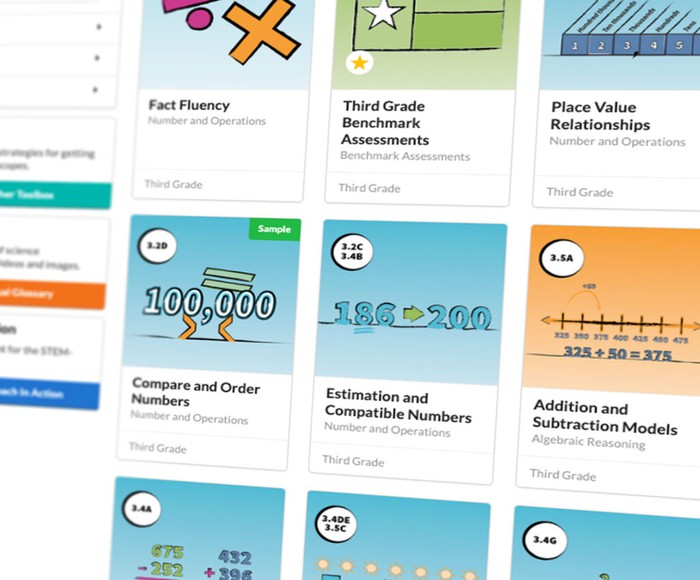
Every STEMscopes Math lesson is built from the ground up to the standards. Chunking information into bite-size pieces, we make our units (called “scopes”) digestible and engaging. On average, a scope takes one to two weeks.
HOME
Build your own content knowledge, analyze the standards, and gain an understanding of everything the scope has to offer here in the Home section. This is where you will find all your lesson planning materials so you can facilitate fun, purposeful experiences for your students.
ENGAGE
The Engage section is all about laying the foundation for learning. You begin this section by pre-assessing students and filling knowledge gaps. The Hook then lays out a storyline narrative to establish a purpose for learning and captures students’ attention with real-world connections.
EXPLORE*
This is where students dig into the meat of the content. The Explore section provides scaffolded hands-on activities that build toward mastery of the standards. Each Explore provides prompts for rich mathematical discourse and student reasoning, along with an Exit Ticket. Remember to use each Explore with a real-world independent practice (Show What You Know) before proceeding to the next Explore so that you can adjust instruction, if necessary, based on student misconceptions.
EXPLAIN*
Paired with Explore, the Explain section offers a variety of resources that help connect the experiences of the Explore activities to the academic content students need to know. These resources include illustrated vocabulary cards, independent practice, and journal prompts that can be used to support the Explore activities and solidify student learning.
ELABORATE*
Workstations are a go! The Elaborate section makes differentiation a cinch with ready-made activities—digital and paper-based games, spiraled review, career connections, literacy connections, and more—perfect for rotations! These activities allow students to continue learning while you make time for small group interventions, reteaching, and independent projects to help both your struggling and advanced learners.
*Instructional elements in STEMscopes Mathematics are intended to work together. The elements in the Explain and Elaborate sections can be used to support student learning and provide opportunities to practice while the students are exploring the concept.
EVALUATE
Get the data you need from the assessment tools provided in the Evaluate section. From multiple choice-based assessments to an open-ended reasoning prompt, there’s an evaluation for every student’s learning style. You can also create your own assessments at any time using the Assessment builder tool.
INTERVENTION
Useful during Elaborate or as an after-school support, Intervention contains a small hands-on activity designed to target students’ conceptual misunderstanding while building their math skills. Did we also mention this is a great re-teach and test prep tool?
ACCELERATION
Are your students ready to go above and beyond with what they’ve just learned? In the Acceleration section, students can engage in a design challenge or relate what they’re learning to current events around the world—activities that prompt them to think more deeply about the content and its applications.
EVERYTHING IN ONE PLACE: LEARNING MANAGEMENT SYSTEMS
STEMscopes, the nation’s leader in K-12 STEM education, PowerSchool’s Schoology, and Canvas provide a communication and collaboration platform that fully supports in-person, online, or blended learning instruction. In one streamlined integration, we make online learning easy to access, simple to manage, and successful for your district’s administrators, teachers, students, and parents.
KEY FEATURES
Deep Linking
Get all your instructional resources in one place—there’s no need to log in anywhere else to connect STEMscopes resources to your lesson plans and more.
Grade Passback
Any graded activity taken in STEMscopes instantly transfers to your school/district gradebook.
Data Integration
Enhance teacher-to-teacher interaction and collaboration by using STEMscopes lesson materials from the comfort of your LMS.
All School Information Systems
We integrate with all SIS that schools/districts use.
MEET OUR AUTHORS
Here at STEMscopes, our diverse team of Math Authors take time to meticulously craft our curriculum from start to finish. Each of them comes to use with their own unique expertise and perspective on the joys of STEM education. Take your time to read about all of our team members and see what sets them and STEMscopes apart from the rest.


The 5E+IA Instructional Model Guide

Intentional Discourse Guide

Productive Struggle Guide

Real-World Connections Guide